A sluggish Mac can disrupt your workflow, but understanding system performance factors can help you regain control. macOS’s Activity Monitor is your window into these factors—CPU, memory, disk, network, and energy usage. In this guide, we’ll break down these critical performance elements and show you how to use Activity Monitor to monitor and optimize them, ensuring your Mac runs at peak efficiency.
What Is Activity Monitor in macOS?
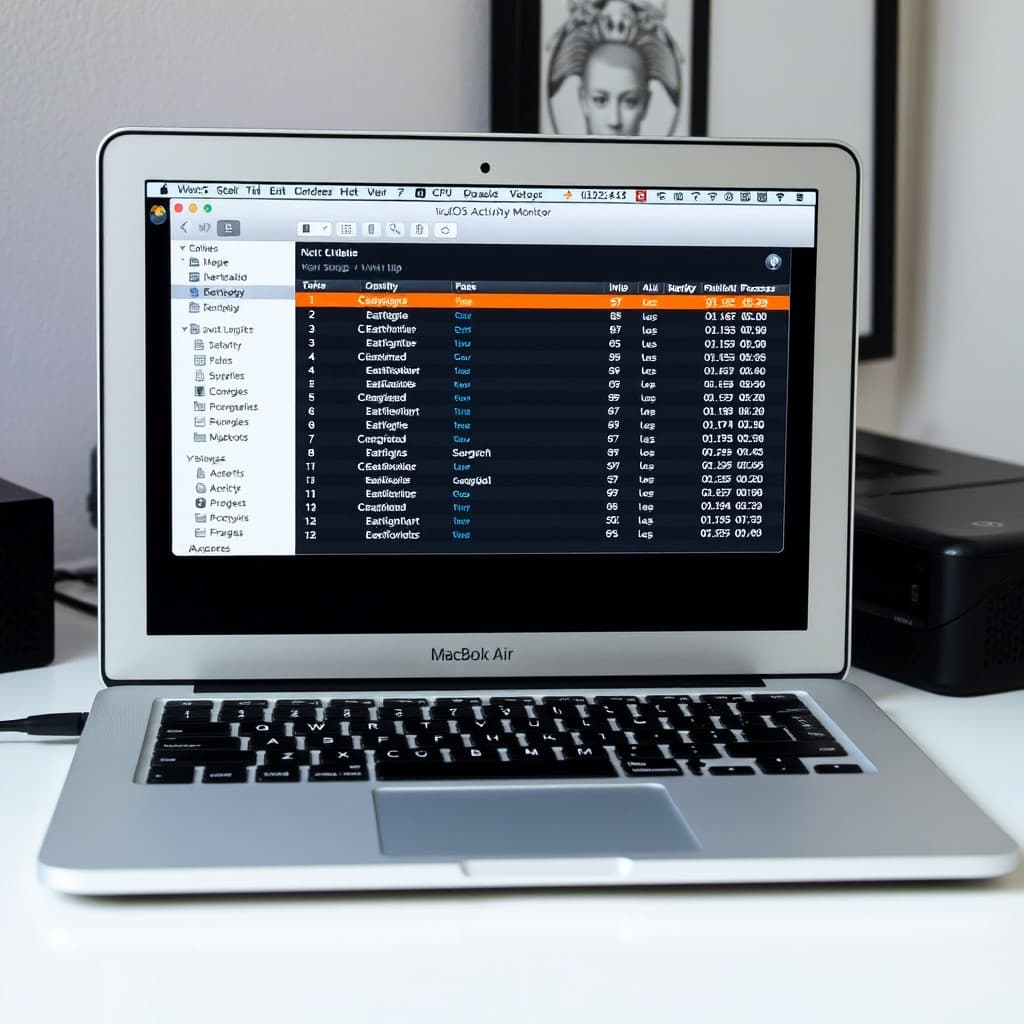
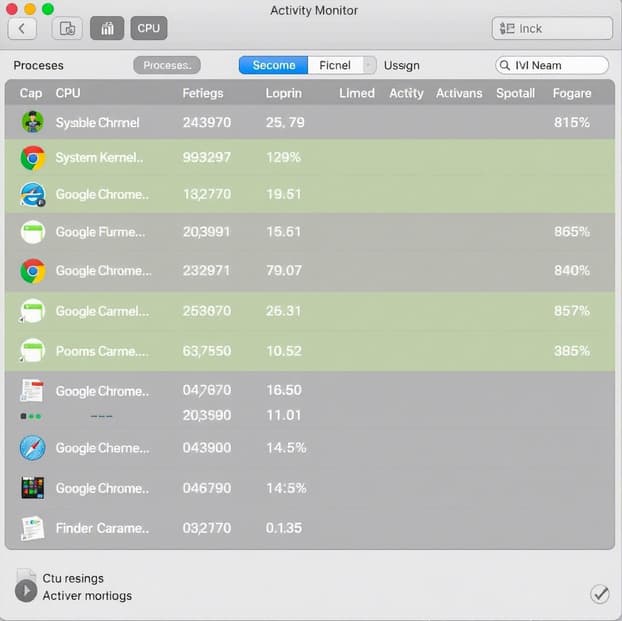
Activity Monitor is macOS’s built-in diagnostic tool, offering real-time insights into system resource usage. It’s a technician’s best friend for identifying bottlenecks and optimizing performance. From CPU-intensive processes to memory leaks, Activity Monitor covers it all.
To access it:
- Press Command + Space to open Spotlight Search.
- Type “Activity Monitor” and press Enter.
- Explore the tabs—CPU, Memory, Energy, Disk, and Network—to analyze performance.
Key System Performance Factors in macOS
Performance isn’t just about CPU speed. Multiple factors interplay to determine how your Mac behaves. Below, we’ll explore these factors and how to leverage Activity Monitor to manage them.
1. CPU Usage: The Processing Powerhouse
- What it is: Measures how much of your Mac’s processor is in use.
- Why it matters: High CPU usage can slow apps or cause overheating.
- How to use it: In the CPU tab, sort by “% CPU” to spot hogs like kernel_task or WindowServer. Quit unnecessary apps or processes with the “X” button.
- Optimization tip: Check “System” vs. “User” CPU usage at the bottom to isolate system-level strain.
2. Memory Usage: RAM Management
- What it is: Tracks how much RAM apps and processes consume.
- Why it matters: Low free memory forces macOS to use swap space, slowing performance.
- How to use it: Switch to the Memory tab. Look at “Memory Used” and “Swap Used” at the bottom. If “Memory Pressure” is red, quit memory-heavy apps like Photoshop.
- Optimization tip: Restart your Mac to clear cached RAM.
3. Energy Usage: Battery and Heat Impact
- What it is: Shows which apps drain power or generate heat.
- Why it matters: High energy use shortens battery life and stresses hardware.
- How to use it: In the Energy tab, check “Energy Impact” scores. Apps like Chrome with high values can be quit or replaced with lighter alternatives (e.g., Safari).
- Optimization tip: Enable “Show Battery Status” for laptops to monitor trends.
4. Disk Usage: Storage and I/O Activity
- What it is: Monitors read/write activity on your drive.
- Why it matters: Excessive disk usage can bottleneck performance, especially on older HDDs.
- How to use it: Go to the Disk tab. Watch “Data read/sec” and “Data written/sec”. Processes like backupd (Time Machine) may spike here—pause backups if needed.
- Optimization tip: Free up disk space if your drive is near capacity.
5. Network Usage: Bandwidth Consumption
- What it is: Tracks data sent and received over your network.
- Why it matters: Heavy network activity can slow internet-dependent apps.
- How to use it: In the Network tab, sort by “Sent Bytes” or “Rcvd Bytes”. Processes like cloudd (iCloud syncing) may dominate—pause syncing to reduce load.
- Optimization tip: Use “Netstat” in Terminal for deeper network diagnostics.
6. Thermal Management: Hidden Performance Factor
- What it is: macOS adjusts performance to manage heat via processes like kernel_task.
- Why it matters: Overheating triggers throttling, reducing speed.
- How to use it: In the CPU tab, monitor kernel_task. High usage here often means thermal limiting—clean fans or reduce workload.
- Optimization tip: Use third-party tools like smcFanControl for fan speed insights.
7. Background Processes: Silent Resource Users
- What it is: System and app services running behind the scenes.
- Why it matters: Unchecked background tasks can sap resources unnoticed.
- How to use it: Filter Activity Monitor for processes like launchd or mds_stores (Spotlight indexing). Disable unnecessary startup items in System Settings > General > Login Items.
- Optimization tip: Pause Spotlight indexing with sudo mdutil -a -i off.
How to Optimize Performance with Activity Monitor
- Identify Bottlenecks: Use each tab to pinpoint the limiting factor (e.g., high “Memory Pressure” or “Disk I/O”).
- Take Action: Quit resource-heavy apps/processes or adjust settings (e.g., pause iCloud).
- Monitor Trends: Watch the graphs at the bottom of each tab for spikes or sustained high usage.
- Diagnose Issues: Use “Sample Process” (View menu) to analyze hung apps.
- Restart as Needed: A reboot can reset many performance hiccups.
Pro Tip: Save Activity Monitor as a Dock icon for quick access during troubleshooting.
When to Act
Minor fluctuations in performance factors are normal, but consistent issues—lagging apps, loud fans, or beachballs—signal a need for optimization. If kernel_task dominates CPU or “Swap Used” climbs, address these promptly to avoid long-term slowdowns.
Conclusion
Understanding and managing system performance factors in macOS is key to a fast, reliable Mac. With Activity Monitor, you can monitor CPU, memory, energy, disk, network, thermal, and background activity, taking control where it counts. Use this guide to optimize your system and keep it humming, and check back for more macOS performance tips!